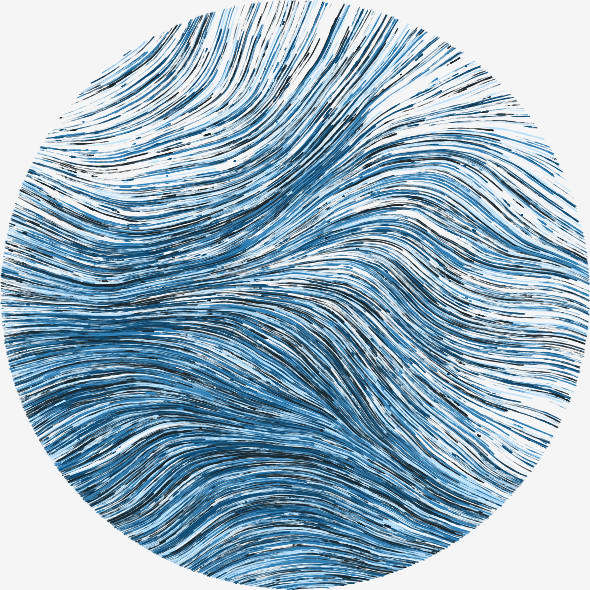
# Load aRtsy (uncomment and run the install.packages() line if it's not installed)
# install.packages("aRtsy")
library(aRtsy)

# Fix the random seed to create the same figure on each run
set.seed(1)

# Create a Flow Field visualisation (after having played around with the
# parameters a bit)
flow <- canvas_flow(outline = "circle",
            background = "#F5F5F5",
            lines = 8000,
            lwd = 0.05,
            stepmax = 0.005,
            colors = colorPalette("dark2"))

# Save the resulting figure as a jpg so that it can be served as a static file and
# be used as the thumbnail for this post
saveCanvas(flow,
       filename = "flow.jpg",
       width = 5,
height = 5)This is the first post on this website. From the outset I can say that I will mostly be doing this for my own benefit – to write down and keep a record of my own thinking for future me. However, that is not to say that I won’t appreciate any readers who happen to drop by along the way.
The website itself was created as part of my postdoctoral research project Modelling the Earliest Human Settlement in the Kattegat-Skagerrak Circumference (MESK), a EU funded MSCA Postdoctoral Fellowship that I just started. The project is being undertaken at Aarhus University from October 2025 until October 2027. While I intend to mainly post about MESK, I will also, at least in part, treat it as a personal website (hence the address iroalkvam.com). There are a couple of reasons for this. For one, I think it is safe to assume that the borders between the project and aspects of my personal life will be blurred. One concrete example of this is how I have now moved from Oslo to Aarhus for the project. I think that trying to treat this as somehow separate from the research I will conduct stands in danger of resulting in an unnatural limitation of what I feel I can write about. Secondly, I also hope to keep using the site after the project has come to a conclusion. I believe that setting up for longevity will involve avoiding limiting myself to what falls strictly within the scientific aspects of MESK.
Some techincal details
Some readers (including future me) might be interested in reading a bit more about the technical details and the motivation for how I chose to set up the site. On the extreme ends of the scale I debated whether I could build the whole site from scratch using HTML/CSS or whether to use a GUI-based platform such as Wordpress. As for Wordpress, I quickly decided against this. For one, I already have experience setting up and maintaining a website for my late mother’s artwork (https://jmhk.no) using Wordpress. It works well enough for the purposes of that simple site, but there are a lot of annoyances with the lack of control Wordpress provides, and I am contemplating migrating that site somewhere else as well. On the other hand, while attempting to build the site from scratch would have given complete control and undoubtedly have been a great learning experience, I also decided against trying this because the result would likely have been worse, it would have taken a lot more time, and given my limited experience with web development, a more user-friendly framework will likely provide more than enough learning opportunities.
For these reasons I went with the Quarto Blog framework. I’m already comfortable with the use of R and Quarto and so this was easy to set up. Furthermore, as Quarto allows you to write literate programming documents that can include text, images, code and rendered output such as figures (see https://github.com/quarto-dev/quarto-cli#quarto) it fits perfectly with my intended use, as I will be including all of these elements in my posts. I currently develop the site in the integrated development environment (IDE) Positron, which I’m experimenting with as a possible replacement for RStudio.
A static and open source website
I have my domain from host1, a Norwegian hosting company, where I have already paid for a one-year hosting plan as well. However, after first dipping my toes into web-development I have become aware of some very interesting initiatives for both developing, hosting and serving websites. One of these is homebrewserver.club which promotes setting up and running websites in light of social, political and economic needs, goals and principles. This involves using free and open source software and to host using low-power solutions from home, rather than from data centers. The hosting-the-website-myself part of this will remain an ambition for now, not least because I already paid for the hosting plan at host1, but the open and minimal footprint aspects as related to how the content of this site are served are with me from the start. Some related initiatives to homebrewserver.club is Sustainable Web Design, the Feminist Server Manifesto, as well as the concept of Minimal Computing that I was recently made aware of in a Mastodon thread initiated by Joe Roe.
As for the open aspect of the website, all of the code that goes into creating this site is fully and freely available here https://codeberg.org/isakro/iroalkvam and everything on the website is explicitly released under the license CC BY-NC 4.0. Another principle that homebreserver.club recommends is to use static websites, which this site also is. What this means is that all of the content on this is site is rendered from static files that are stored on the server-side of the site, meaning the content is not dynamically generated with new visitors or as a visitor interacts with the site. That requires more energy. Although I have included code, for example to generate the images that I will use for the thumbnails of my posts (see below), this code has been run once by me to generate the files that I need. These are then served as static images and the code is never run again.
Finally then, just to give an example of how Quarto can be used to display and show the results of code, I’ve included the code chunk below, written in the R programming language. This generates the image that is also used for the thumbnail for this post. I feel my site needs some light-weight graphics, and since I’m interested in exploring the world(s) of creative data visualisation and generative art, I used the R package aRtsy for this. aRtsy makes a series of algorithms for generative art readily available for novices to explore (see https://koenderks.github.io/aRtsy/).